
ERMaster is GUI editor for ER diagram.
It runs as Eclipse plug-in.
It can be done graphically to making ER diagram, printing ER diagram, exporting the DDL from ER diagram, etc. .
Moreover, importing from DB, management of the group, and the historical management, etc. are supported.
ERMaster is being developed with Eclipse 4.3(Kepler) now.
It corresponds to the following data bases now.
Although it doesn't completely correspond to these DB.
Please add following URL in
[Help] -> [Softward Updates] -> [Find and Install...] -> [Search for new features to install]
[New Remote Site...] from the menu of Eclipse.
http://ermaster.sourceforge.net/update-site/
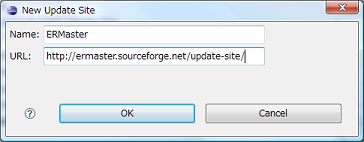
Push [Finish] button while selected for added URL.

Put the check to [ERMaster], and push [Next] button in the Update dialog.

Execute the installation according to the displayed message.


After restarting Eclipse, ERMaster is added in [File] menu of Eclipse as
[New] -> [other...] -> [ERMaster].


The editor of ERMaster is launched by default when the file with extension "*.erm" is opened by double-clicking.
When you want to make the file newly,
select [right-clicks in the project] -> [New] -> [other...] -> [ERMaster].


After the wizard opens, input the file name and select the database system to be used.
(Even after making the file, it is possible to change the database system. )


The file is made when the [Finish] button is pushed, and the editor is launched.

The Eclipse views that can be used with ERMaster are following.
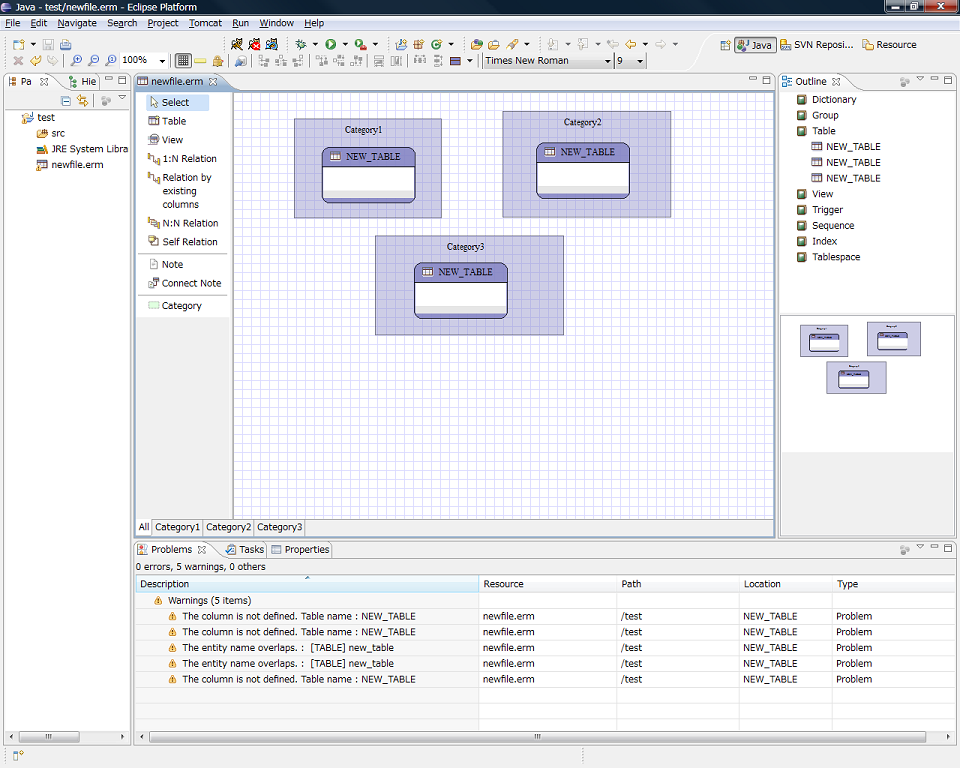

Editor view is the main view of ERMaster.
ER diagram is drawn in this view. The palette is displayed on the left side.
The tab of each [category] is displayed below.
The list of the object is displayed in the upper side in the outline view,
and in the lower side, the whole image of ER diagram is displayed as thumbnail.

The problems that current ER diagram has are displayed in the problem view.
The content of the problem view is not updated only by changing data, and updated by saving the file.

The content that the manufacturer is describing as a task is displayed in the task view.
The task can be registered by describing the description that starts by "// TODO"
in [Description] field of [Table], [Column], etc.
The content of the task view is updated by saving the file just like the content of the problem view.

The property of the object that has been selected now is displayed in the property view.
This view might be so useless, because informations displayed in this view are still little now.
When the campus is clicked, a present database is displayed.
You are able not only to confirm the value but also to change the value in the property view.

It is possible to save the file by [Ctrl] + [S] or [File] -> [Save] in the menu bar.

"*.erm" file is XML form.
It is possible to edit it directly by opening with the text editor.


Click the [New Table] tool in the palette of the ER editor.
And when becoming a selective state, click an arbitrary place of the canvas.
Click the [New Table] tool.

Click the canvas.

[Table Information] dialog opens when the table is double-clicked.
The table name and the columns can be edited by this dialog.

Right-clicks the table, and select [Delete] in the popup menu.
It is possible to delete it by even pushing the [Delete] icon in the toolbar
or [Delete] key with the table has been selected.
Select [Delete] in the popup menu.

[Delete] icon in the toolbar

[Column Information] dialog opens when the [Add] button is pushed
in [Table Information] dialog.
When 'Physical Name', 'Logical Name', 'Type and length', 'Constraint',
'Description', and 'Default value', etc. are set in this dialog, and [OK] is pushed,
it is reflected in [Table Information] dialog.
When [OK] is pushed in [Table Information] dialog, the column is added to the table.
Push [Add] button in [Table Information] dialog.

[Column Information] dialog.

Reflected in [Table Information] dialog.

Columns are added to the table.

To edit the column, select the column and push [Edit] button.
When 'Physical Name', 'Logical Name', 'Type and length', 'Constraint', 'Description', and 'Default value', etc.
are changed in opened [Column Information] dialog, and [OK] is pushed,
it is reflected in [Table Information] dialog.
When [OK] is pushed in [Table Information] dialog, the columns of the table are changed.
Select the column and push [Edit] button in [Table Information] dialog.

Edit in [Column Information] dialog.

Reflected in [Table Information] dialog.

The columns of the table are changed.

In ERMaster, the idea of [word] has been introduced into the column.
Please see Management of word for details.
To eidt the culumn with another word, set the blank to the [word] pull-down
in editting in [Column Information] dialog.
To delete the column, select the column and push [Delete] button in [Table Information] dialog.
When [OK] button is pushed after it is reflected in [Table Information] dialog,
the column is deleted from the table.
Select the column and push [Delete] button in [Table Information] dialog.

Reflected in [Table Information] dialog.

The columns of the table are changed.

To add constraints such as primary key, unique key, and the NOT NULL to the column,
check the checkbox of Primary Key, NOT NULL, and UNIQUE in [Column Information] dialog.
[Column Information] dialog is opened by selecting the column to be changed
and pushing [Edit] button in [Table Information] dialog that is opened when the table is double-clicked.
Select the column and push [Edit] button in [Table Information] dialog.

Check the checkbox in [Column Information] dialog.

To set the constraints other than a primary key, NOT NULL, and a unique key,
describe it in [Detail] tab of [Column Information] dialog.
For instance, to set the CHECK constraint to the column, describe as shown in the following figure.

To set the constraint name of a primary key,
it is possible in the [Constraint/Option] tab of [Table Information] dialog
but not in [Column Information] dialog.
And to set the constraint name of a complex unique key,
it is possible in the [Complex unique key] tab of [Table Information] dialog.
Because they are not constraints for a column but for the table.
Default value can be set in [Column Information] dialog.
Double-click the table, and select the column to which you want to set [Default value],
and push [Edit] button.
Then input [Default value] and push [OK] button.

In addition to input the value directly,
if the type of column is character, it is possible to select the special value <EMPTY_STRING>.
And if type type of column is datetime, it is possible to select the special value <CURRENT_TIME>.

Description can be set in [Column Information] dialog.
Double-click the table, and select the column to which you want to set [Default value],
and push [Edit] button.
Then input [Description] and push [OK] button.

The order of columns can be changed with selecting the column that is wanted to change,
and pushing [Up] or [Down] button in [Table Information] dialog.


To add columns quickly, [Quick Add] button and dialog is useful.
Push [Quick Add] button.

And input columns information by [Quick Add] dialog.

When [OK] is pushed, columns are added to the table.

In [Quick Add] dialog, the clipboard of OS can be used.
Because it can copy/cut/paste by assuming the data of the selected area
to be data of the tsv (tab separeted values),
It is possible to put it on ERMaster by copying it from Excel.
And like Excel sheet, it is possible to copy/cut/paste by selecting from the pop-up menu
which is displayed by right-clicks,
or by pushing [Ctrl] + [c] / [Ctrl] + [x] / [Ctrl] + [v].

Complex unique key is added to the table in [Complex Uniqu Key] tab of [Table Information] dialog.
Check the checkbox of target columns, and push [Add] button in [Complex Unique Kye] tab.

The comlex unique key is added, and the added comlex unique key is displayed to the pull-down.

To change the pair of the columns that composes the complex unique key,
select the complex unique key to be edited by the pull-down
and change the status of checkbox, and push [Update] button.

The pair of the columns that composes the complex unique key is updated,
and the display of the pull-down is updated.

To delete the complex unique key,
select the complex unique key to be deleted by the pull-down and push [Delete] button.

The Complex unique key is deleted, and it disappears from the pull-down.

Neither the update nor the deletion to the complex unique key referenced by the foreign key can be done.
When you select the complex unique key referenced by the foreign key by the pull-down,
[Update] and [Delete] button become nonactive.

Constraints and options for the table can be set in [Constraint/Option] tab of [Table Information] dialog.
For instance, if you describe as shown in the following figure.

DDL will be Generated as below.

The index is added to the table in [Index] tab of [Table Information] dialog.
When [Add] button is pushed in [Index] tab, the [Index Information] dialog will open.
[Double-clicking the table]. Select [Index] tab. Push [Add] button.
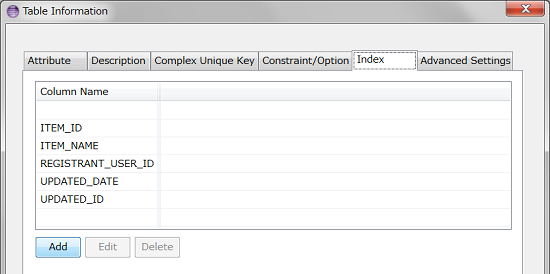
[Index Information] dialog.

Input [Index Name], move all columns which compose the index to [Index column].
The order of index columns can be changed by pushing [Up] or [Down] button.

When [OK] is pushed, it is reflected in [Index] tab of [Table Information] dialog.

When [OK] in [Table Information] dialog is pushed, added [Index] is displayed under [Index] item of [Outline] view.

Double-click the table, and select [Index] tab.
Select the upper radio button of the index that is want to change,
and push [Edit] button.

When it is edited in [Index Information] dialog, and [OK] is pushed,
it is reflected in [Table Information] dialog.


When [OK] is pushed, It is reflected to [Index] of [Outline] view.

Double-click the table, and select [Index] tab.
Select the upper radio button of the index that is want to delete,
and push [Delete] button.

The index is deleted from [Table Information] dialog.

When [OK] is pushed, It is reflected to [Index] of [Outline] view.

The relation can be made by clicking relation tools on the palette.
By default the line of the relation is a straight line that connects the middle points of each table.
When the column that can be referenced doesn't exist, the relation cannot be made.
The column that can be referenced indicates the following either.
Click [1:N Relation] tool on the palette.

The mouse pointer is changed to the one for the relation,
so after clicking the table for one, click the table for N.


The foreign key column for the relation is added to the table for N.
Moreover, a related column is displayed with the color by selecting the relation.

[1:N Relation] tool automatically adds the foreign key to the table for N.
When the column for foreign key already exists as a usual column in the table for N,
and if you want to make only the relation, use not [1:N Relation] tool
but [Relation with existing column] tool.
Click [Relation with existing column] tool on the palette.

The mouse pointer is changed to the one for the relation,

The dialog to set the correspondence of the referenced column and the foreign key column will open.

When the correspondence of the referenced column and the foreign key column is set and [OK] is pushed,
the relation is made.


Click [N:N Relation] tool on the palette.

The mouse pointer is changed to the one for the relation,
so after the table for one is clicked,

the table for the other is clicked.

The relation table is made.
If need, properly edit it.

Click [Self Relation] tool on the palette.

The mouse pointer is changed to the one for the relation,
so click the table for which you want to make the self-relation.

The foreign key column for the relation is added to the table.
If need, properly edit it.

Double-click the line for relation.

[Relation Information] dialog opens, so edit necessary parts.
At [Referenced Column] field only the column that can be referenced is displayed.
The column that can be referenced indicates the following either.


Click the line for relation, and right-click it that became selective state.
Then select [Delete] in the pop-up menu.

The confirmation dialog whether to delete the column set as the foreign key
at the same time is displayed.

The foreign key is deleted at the same time as relation when [Yes] is chosen by the confirmation dialog.

When [No] is chosen by the confirmation dialog, only the relation is deleted,
and the foreign key remains as a usual column.

The addition, the edit, and the deletion for the view look like
the addition, the edit, and the deletion for the table.
Click the [Create View] tool in the palette of the ER editor.
And when becoming a selective state, click an arbitrary place of the canvas.
Click the [Create View] tool.

Click the canvas.

[View Information] dialog opens when the view is double-clicked.
The name and the columns and the sql of the view can be edited by this dialog.

Right-clicks the view, and select [Delete] in the popup menu.
It is possible to delete it by even pushing the [Delete] icon in the toolbar
or [Delete] key with the view has been selected.
Select [Delete] in the popup menu.

Because the management of the column of the view is similar to the management of the column of the table,
see Management of column of the table.
However, the constraint such as primary key, NOTNULL, unique key
and the default value cannot be set to the column of the view.
Moreover, the columns informations set for the view are used only to display them in ER diagram
and in the DB definition document on the Excel/HTML form.
They are not reflected in DDL at all.
[Note] can be added to ER diagram.
Click [Create Note] tool of the palette.

The mouse pointer is changed, so click an arbitrary place of the canvas.

If [Note] is double-clicked, the direct edit becomes possible.

To connect the note to the table, click [Connect Note] tool of the palette,
and click the note and the table.

[Category] is a tool to express the classification of some tables.
The table that belongs to two or more categories can be expressed.
Select [![]() ] icon of the palette.
] icon of the palette.
Then after the mouse is changed, click the canvas, and without releaseing the mouse button,
select the tables that you want to have them belong to the category, and release the mouse button.

The category is added at the clicked point.
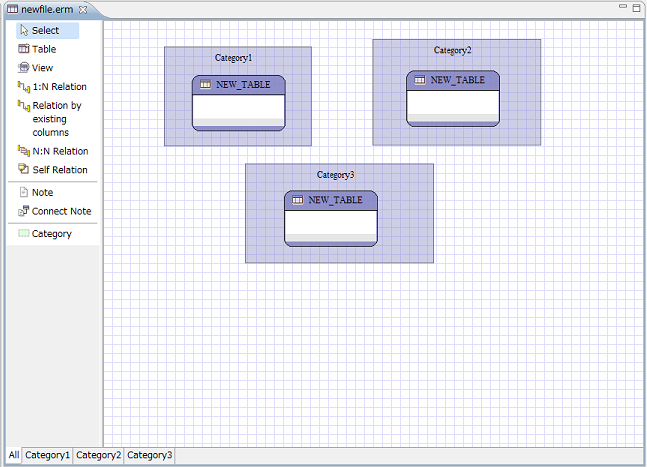
When the category is added, the tab for the category is added under the canvas.

Only the tables that belong to the category are displayed in the tab of each category.
For instance, when the tab of a category is selected with three categories exist as shown in the figure below,

only the tables that belong to the category are displayed.

In addition, the category also can be added by inputting the category name in [Category] dialog
opened by [right-clicks on the canvas] -> [Category] -> [Management of category],
and pressing [Add] button.

Input the category name, and push [Add] button.

The category name can be changed in [Category] dialog.
[right-clicks on the canvas] -> [Category] -> [Management of category]

Select the category to be edited.

Edit the category name, and push [Update] button.

The category name displayed on the canvas and the tab name are changed.

In addition, if double-click the tab, [Change Category Name] dialog open.

Right-click in the category, and select [Delete] by the pop-up menu.
It is possible to delete it by even pushing [Delete] icon of the toolbar
or by pushing [Delete] key with the category has been selected.


The category can also be deleted by selecting the category to be deleted
and pressing [Delete] button in [Category] dialog displayed by
[right-clicks on the canvas] -> [Category] -> [Management of category].

If you want to disable the category temporarily,
check off the checkbox of the category on the left side in [Category] dialog.

Tables can be added to the category by dragging tables in the area of the category.


The table can be added to the category by even completely enclosing the table
by dragging the frame of the category and expanding the category area


Moreover, tables also can be added to the category by selecting the category and
checking the checkbox of tables on right side, and even pressing [OK] button in [Category] dialog
displayed by [right-clicks on the canvas] -> [Category] -> [Management of category],

The table can be removed from the category by dragging the table,
and removing from the area of the category completely.


If the dragged table is remained in the category area even a little,
the table is not removed and the area of the category expand.


Tables also can be removed from the category by even selecting the category,
and checking off the checkbox of tables on right side, and even pressing [OK] button in [Category] dialog
displayed by [right-clicks on the canvas] -> [Management of category],

By default, only the tables that belong to the category are displayed in the tab of each category.
If you want to display tables which are referenced by the table in the category,
[right-click on the canvas] and select [Category] -> [Display referenced table] in the popup menu.
For instance, when the tab of green category is selected with categories shown in the figure below,

only the tables that belong to the category are displayed.

But by [right-click on the canvas] and selecting [Category] -> [Display referenced table] in the popup menu.

Also referenced tables are displayed.

[Image] can be added to ER diagram.
Click [Insert Image] tool of the palette.

The mouse pointer is changed, so click an arbitrary place of the canvas.
Then File Open Dialog opens. So select the image file to be added.

Then selected image will be inserted to the diagram.

To change properties of the inserted image, double-clicke the image.
Then [Image Information] dialog opens.

In [Image Information] dialog, Hue, Saturation, Brightness and Alpha
of the image can be set.
Change these values and push [OK] button,

then the image on the canvas change.

By default the aspect ratio of the image is fixed.

If you want to change the aspect ratio, check off the checkbox in [Image Information] dialog.

Then you can freely change the aspect ratio.

In ERMaster, the one that "Logical Name", "Physical Name", "Type", "Length", "Decimal", and "Description"
were grouped is expressed by [Word].
The column of each table is made from [Word], and "Constraint" and "Default value" are added.
Sets of [Word] is called [Dictionary], and displayed in [Outline] view.

[Word] cannot be added only by itself.
When the column was added without selecting [Word] in [Column Information] dialog,
[Word] will be added automatically.
The table is newly added,

and add two columns without selecting [Word].


Then in [Outline] view, it can be seen that two [Word]s are added.
And the tables that use the [Word] are displayed under the [Word].

If a column was added with selecting [word] in [Column Information] dialog,


then new [Word] is not added, and the tables that use the same [Word] increase.

If a column was added without selecting [word] in [Column Information] dialog,
even if the column has the same "Logical Name", "Physical Name", "Type" with the other column,
the new word is added as a different word.


When a [Word] is edited, the edited contents are reflected in all columns that use the same [Word].
There are two methods for editing [Word].
The first method is a method to editing the column that uses [Word].
When the column is edited, the used [Word] is edited at the same time.
Therefore, when you use the same [Word] by two or more columns as shown in the following figure

When you edit the one of columns,

The column information on the other table is updated at the same time.

If you want to update column information on the only one of tables,
it is necessary to update it to use a separate word.
If the column is edited with selecting empty at [Word] field as shown in the following figure,
a new word with same information is made.

By doing so, two columns that was originally using the same one [Word] can be divided
into the columns using diferrent [Word].

The second method is a method to editing the word by [Word Information] dialog
that is opened by double-clicking [Word] icon [![]() ] under [Dictionary] of outline view.
] under [Dictionary] of outline view.
[Outline] view

[Word Information] dialog opens, and [Word] can be edited.

There is no operation that deletes [Word].
[Word] which is not used with any column is automatically deleted.
The column with information of the [Word] can be added to the table by drag and dropping the [Word] icon[![]() ] of [Outline] view to the table of the canvas.
] of [Outline] view to the table of the canvas.


By making a group that collects some columns,
more than one columns can be registered, edited, deleted together as a group.
For instance, if columns such as "UPDATED_DATE", "REGISTRATION_DATE", "UPDATED_USER", and "REGISTRANT_USER"
that all tables similarly have are registered as a group,
it becomes very easy to add four columns for each table.
Right-click in [Group] of [Outline] view,
and select [Management of group] from the displayed pop-up menu.

[Manage of group] dialog opens, so push [Add group] button.

It becomes possible to input group information.
Input the group name, and push [Add] button.

Input column information in the displayed [Group Column Information] dialog
and push [OK] button.

Column information is added to the group.
Add necessary columns to the group by the same procedure.
When the addition of the columns are finished, push [Update] button.

When [OK] button of [Management of group] dialog is pushed, the added groups are reflected.

Moreover, the group management dialog can be opened even by pushing [Management of Group]
button in [Table Information] dialog opend by double-clicking the table

Double-click the group to be edited in [Group] of [Outline] view.

[Group Information] dialog opens, so select the column to be edited and push [Edit] button.

When [Group Column Information] dialog is displayed,
edit the content, and push [OK] button.

When the edit of all columns is finished, push [OK] button.

It is reflected in the table.

Select the group to be deleted from [Outline] view,
and right-click it and select [Delete] menu.

The group is deleted, and the group is removed from all tables that use the group.

Drag the group displayed in [Outline] view and drop to the table.


Moreover, the group can be added even by the following method.
Selected the group by [Group] pull-down field in [Table Information] dialog
opend by double-clicking the table,

and click [Add the group item to the table] button.

The group is added to the table when information is fixed by pushing [OK] button.


It is possible to removing [Group] from the table in a similar way to removing a usual column.
Selected the group that wants to be delteted and push [Delete] button in [Table Information] dialog
which is opend by double-clicking the table.

When the group is deleted, fix the information by pushing [OK] button.


It is possible to register the group that wants to be shared by two or more projects as a [Global group].
When the .erm file is newly created, the file contains the group registered as a [Global group] from the beginning.
To manage a global group, select [Window] -> [Preferences...] from the menu of Eclipse,
and select [ERMaster] in [Preference] dialog, and push [Management of global group] button.

The group is added/edited/deleted in the same way as in usual group management.

It is possible to add a group to global groups by selecting the group and pushing
[Add to global group] button in [Group Management] dialog of a usual group.


The group added to the table is expanded and all columns are displayed in default.

By selecting [Expand group] in the pop-up menu displayed by right-clicking on canvas,

the group will be folded, and only the group name comes to be displayed.

The addition, the edit, and the deletion of the trigger are done in [Outline] view.
Right-click [![]() ] trigger icon in [Outline] view,
] trigger icon in [Outline] view,
and select [Add Trigger] by the pop-up menu.

[Trigger Information] dialog opens, so input the name and SQL of the trigger and push [OK] button.

The created trigger is added to [Outline] view.

Double-click the trigger to be edited from the triggers of [Outline] view.

[Trigger Information] dialog opens, so input necessary information and push [OK] button.

The trigger is edited, and it is reflected in [Outline] view.

Right-click the trigger to be deleted from the triggers of [Outline] view,
and select [Delete] of the pop-up menu.

The trigger is deleted, and it is reflected in [Outline] view.

The addition, the edit, and the deletion of the trigger are done in [Outline] view.
The created sequence cannot be related to the table.
Right-click [![]() ] sequence icon in [Outline] view,
] sequence icon in [Outline] view,
and select [Add Sequence] of the pop-up menu.

[Sequence Information] dialog opens, so input necessary information and push [OK] button.

The created sequence is added to [Outline] view.

Double-click the sequence to be edited from the sequences of [Outline] view.

[Sequence Information] dialog opens, so input necessary information and push [OK] button.

Right-click the sequence to be deleted from the sequences of [Outline] view,
and select [Delete] of the pop-up menu.

The sequence is deleted, and it is reflected in [Outline] view.

[Management of tablesapece] is being developed now.
By [Edit all attributes] dialog, it is possible to edit all columns in one dialog.
Select [Edit all attributes] in the pop-up menu which is displayed by right-clicking on the canvas


Copy the selected tables by [Ctrl]+[c],
and paste the copied tables by [Ctrl]+[v].
Copy by [Ctrl]+[c]

Paste by [Ctrl]+[v]

Copy/Paste of the table is able to be done from not only current file,
but also other files.
Copy by [Ctrl]+[c]

Open another file, and paste by [Ctrl]+[v]

If the table that is copied from another file has a group
with the same name as the group that is included in destination diagram,
the group will not be copied and the group in the pasted table
will be replaced with destination diagram's one.
It is possible by drag and drop to move the column to another table.
Select the column that you want to move.

Drag and drop to the destination table.

When you cannot select the column,
please confirm [![]() ] of the toolbar is not locking.
] of the toolbar is not locking.

The table can be moved by dragging the table directly.
The whole image is displayed under the [outline] view.
Moreover, refer to [Change scale] to zoom in or zoom out.
In default, to enable [Move column], it is necessary to select the parts other
than the column of the table to select the table.
If it is difficult to select the table, put [![]() ] of the menubar into the state of the lock.
] of the menubar into the state of the lock.
By doing so, even if the column part is clicked,
the table comes to be selected.
When you want to move a table besides the canvas displayed now,
Screen scrolls by dragging the table to the edge of the canvas and stopping at the point
without releasing the mouse button.
Draggin the table

Screen scrolls by stopping at the point without releasing the mouse button.

Drop at the point that you want to move to.

The tables can be lined up by pushing the following icons in the menubar
with two or more tables selected.


To change the size of the table, drag the white point (handle) that is displayed when the table is selected.


After selecting the table,
and selecting [Self adjustment of size] by the pop-up menu which is displayed by right-clicking,
the size of the table can be adjusted by present volume of data.


When the table is selected, and [![]() ] icon of the menubar is pushed,
] icon of the menubar is pushed,
the color of the table is changed.
Select the table.

When you click the icon of the menubar

The color is changed.

To change the color of [![]() ] icon of the menubar,
] icon of the menubar,
push [![]() ] icon on the side of [
] icon on the side of [![]() ] icon,
] icon,
and select the color by the displayed dialog.

Though the line of the relation becomes a straight line by default,
The connection point to the table can be changed, and the line can be bent.
When a related line is selected, the handle is displayed in connected part of the table.

It is possible to move to an arbitrary place of the table by dragging this handle.

Moreover, when a related line is selected, the handle is displayed at the center of the line.

The line can be bent by dragging this handle.

Moreover, the line can be a straight line that is bent at a right angle
by selecting [Right Angle Line] in the pop-up menu.


When you want to return the line to one when it is created,
select the line and right-click it, and select [Back to the default] by the displayed pop-up menu.


The font of the table is changed when the table is selected,
and the value is changed by the font pull-down in the menubar.


Similarly, the fontsize of the table is changed, when the value is changed
by the fontsize pull-down in the menubar,


The display scale of the canvas is changed to scroll the mouse wheel while pushing the [Ctrl] key.
Zoom out:25%

Zoom in:200%

Moreover, it is possible to change by [![]() ] [
] [![]() ] [
] [![]() ] icon
] icon
or the scale pull-down  in the menubar.
It becomes impossible to distinguish the table name when the scale becomes small.
At such time, the table name can be displayed with the tooltip for mouse over and the range selection.
Turn on [Tooltip] in the menubar.

The table name is displayed in case of the mouse over.

Even if the range is selected, the table name is displayed.

The grid line is displayed on the canvas by default.
If it is difficult to see figure because the grid line is obstructive,
the grid line can be non-displayed by turning off [Grid] in the toolbar.


In addition, by turning on [Snap objects to grid] in the toolbar,

when move a table, it move along the grid.

The notation of IE and IDEF1X can be selected.
IE notation

IDEF1X notation

It is possible to switch by selecting either from [Display] -> [Notation] of the pop-up menu
which is displayed by right-clicking on the canvas.

The display level of the table on the canvas and the table of the [Outline] view can be changed.
It is possible in both canvas and [Outline] view, displaying the only logical names,
displaying the only physical names, and displaying both of logical and physical names.
For the canvas
It is possible to do by selecting either from [Display] -> [View Mode] in the pop-up menu
which is displayed by right-clicking on the canvas.

For [Outline] view
It is possible to do by selecting either from [Outlines's View Mode] in the pop-up menu
which is displayed by right-clicking on [Outline] view.

The following display levels can be selected with the table in the canvas.

Three designs that can be selected are prepared.
Each image is as follows.
Funny

Frame

Simple

It is possible to change by selecting either from [Display] -> [Design] in the pop-up menu
which is displayed by right-clicking on the canvas.

When physical name of the tables or the columns are set by the small letter as shown in the following figure

It is possible to display it by the capital letter in the display by selecting [Display] -> [Display by the capital letter]
in the pop-up menu which is displayed by right-clicking on the canvas.
Select [Display] -> [Display by the capital letter]

Physical names are displayed by the capital letter.

If you check [Display by the capital letter], not only the display but also exported [DDL (TXT)]
will be printed by the capital letter.

So, if you want to export ddl by lower case letter, check off [Display by the capital letter].
It is possible to display it as a stamp by setting the property of the project name
and the manufacturer, etc. to ER diagram.
Select [Display] -> [Display the stamp] in the pop-up menu which is displayed by right-clicking on the canvas
to display the stamp.

By selecting [Display the stamp], the stamp is displayed in ER diagram.

You can set the properties displayed in the stamp in [Model Property] dialog
displayed by double-clicking the stamp.

In the [Model Property] dialog, it is possible not only to set the value of the properties prepared by default
but also to add or remove the property.

Information of the properties that is set is reflected in the stamp of figure.

The ER diagram can be made by loading the table definition from the database that exists now.
Create empty ER diagram.

Select [Import] -> [Database] in the pop-up menu which is displayed by right-clicking on the canvas.

[Import from Database] dialog opens, so input necessary information to connect database and push [OK] button.

Then if this is the first time when you do [Import from Database] for selected database,
[JDBC Driver's path] dialog open in which you have to input the path of [JDBC Driver]
which you use to connect to the database.
From the second time, [JDBC Driver's path] dialog path does not open.
See also [JDBC driver].

If it succeeds to connect, then
if selected database support schema, [Select schemas to be imported] dialog opens.
if selected database does not support schema, this step is skipped.

Then after schemas are selected or if selected database does not support schema,
[Select objects to be imported] dialog opens.
so check the tables and views, etc. that you want to import and push [OK] button.

ER diagram is made by loading the checked ones.

In [Import from Database] dialog, JDBC driver to be used is automaticaly decided by selected [Database].
For instance, the default JDBC URL of ERMaster for Oracle is one for [thin driver].

If you want to use [OCI driver], check off the [Use the default driver] checkbox,
and manually input JDBC URL for OCI driver.

The ER diagram can be made by loading the table definition from another .erm file.
erm file that another file will be imported to.

erm file that will be imported.

Select [Import] -> [File] in the pop-up menu which is displayed by right-clicking on the canvas.

[Open] dialog opens, so select the erm file to be loaded and push [Open] button.

The list of tables and views, etc that exist in the selected file will be displayed,
so check the ones that you want to import and push [OK] button.

The tables and indexes, etc loaded from another erm file are added.

If the table that is imported from another file has a group
with the same name as the group that is included in destination diagram,
the group will not be copied and the group in the imported table
will be replaced with destination diagram's one.
It is possible to get almost same result as importing from file by [Copy/Paste from another file].
Maybe it is more easy by copy & paste.
The point at which the way of importing from file is better is that that is able to
import sequences and triggers and etc, as well as tables.
The image, the DB definition document(EXCEL form), the DB definition document(HTML form), the DDL, the dictionary, and the translation dictionary can be output from ER diagram.
The path of output file can be specified as both of relative path and absolute path.
The relative path is relative to the root directory of the project in which [.erm] file exists.
Some export function need the selection of output directory.
The path of output directory can be specified as both of relative path and absolute path.
The relative path is relative to the root directory of the project in which [.erm] file exists.
In addition, it is possible to input empty as the output directory,
In you do so, the exported files will be output to the root directory of the project
in which [.erm] file exists.
ER diagram can be output to image.
Select [Export] -> [Image] in the pop-up menu which is displayed by right-clicking on the canvas.

[Export to Image] dialog opens, so input the file path and push [OK] button.

The image can be output by three kinds of forms of "*.png", "*.jpeg", and "*.bmp".

if [Export] -> [Image] is selected while displaying [All] tab,
and checkbox for [Output images of each category to 'categories' directory.]
in [Export to Image] dialog is checked,

'categories' directory will be made in same directory as [Output File],
and images of each category are also output in the directory.

Or if [Export] -> [Image] is selected while displaying a category tab,
only the image of the category will be output.

The Excel document can be output from ER diagram.
Jakarta POI is used for the Excel library.
Select [Export] -> [Excel] in the pop-up menu which is displayed by right-clicking on the canvas.

[Export as Excel Document] dialog opens, so
push [OK] button with specifying the output file and the template which is used.

Then the excel file like following figure is output.

The layout of the output Excel can be edited by making an custom template file.
Refer to Create custom template for Excel Document for the method of making the template file.
Excel Document will be output on the basis of the specified template.
There is two way to specify the template.
The first one is the way to specify the template from registered templates.
To register the new template, refere [Register template].

And the second is the way to specify the template file from directory.

HTML document can be output from ER diagram.
Select [Export] -> [HTML] in the pop-up menu which is displayed by right-clicking on the canvas.

[Export as HTML Document] dialog opens, so
push [OK] button with specifying the output directory.

The files as shown in the following figure are made under [dbdocs].

The generated HTML Document is a design of the Javadoc style.
The template of this design cannot be customized unlike Excel document.

If you check the checkbox of [Put ER Diagram on HTML.] or
[Put ERDiagram of each category on HTML.] in [Export as HTML Document],
images will be embedded in HTML Document.

DDL for the database construction can be output from ER diagram.
Select [Export] -> [DDL] in the pop-up menu which is displayed by right-clicking on the canvas.

[Output of the DDL] dialog opens, so input necessary information and push [OK] button.

Output DDL

When there is incompleteness in the table definition the message dialog is displayed,
but DDL can be output by continuing as it is.

If you open the [Export to DDL] dialog in a category tab,

the output ddl will be restricted to the objects belonging to the current category.
The [word] used in current ER diagram can be output by CSV form.
Select [Export] -> [Dictionary] in the pop-up menu which is displayed by right-clicking on the canvas.

The [Save as] dialog opens, so input the file name and push [Save] button.

The message is displayed when succeeding in the output.

The output form becomes "Physical Name", "Logical Name", "Type", and "Description".

ERMaster has the function of [Translation].
It translates a physical name to a logical name when importing the data from DB.
The translation is done by using the translation dictionaries.
The translation dictionary file can be output from current ER diagram to use it
for other database designs.
To output the translation dictionary file from ER diagram,
selecte [Export] -> [Translation Dictionary] in the pop-up menu which is displayed by right-clicking on the canvas.

The [Generation of translation dictionary] dialog opens,
so input the name of translation dictionary and push [OK] button.

The generated dictionary is stored in '$workspace$/.metadata/.plugins/org.insightech.er/translation/',
and can be used from other ER diagrams as a translation dictionary file.


Refer to [Translation] for the usage of the translation dictionary.
It is possible to execute DDL to directly creating tables to database from ER diagram.
* Because this function delete all contents of the database once,
use it only when there is no problem even if the contents of the database are deleted.
To export to DB, click [Export to DB] icon of the toolbar.

When ER diagram is imperfect, the error dialog is displayed,
so execute it again after solving the problems.

The dialog to specify DB to export to is displayed when there is no problem in ER diagram.
Although [Database] field is selectable in [Import from Database] dialog,
[Database] field is fixed at current database in [Export to DB] dialog.

When [OK] button is pushed, all SQL that will be executed is displayed.

If you want to execute only a part of displayed SQL,
make the part to be executed a selective state and push [Execute] button.
Moreover, edited SQL can be executed by editing the displayed SQL and pushing [Execute] button.

When [Execute] button is pushed, the dialog that confirms whether to execute it is displayed,
so push [OK] button.

The following dialog is displayed when succeeding in updating the database.

The following dialog that show the reason of the error is displayed when failing in the update of the database.

Java Sources coresponding to tables can be generated from ER diagram.
Select [Export] -> [Java] in the pop-up menu which is displayed by right-clicking on the canvas.

[Export to Java Source] dialog opens, so input necessary information and push [OK] button.

The files as shown in the following figure are made under specified [Output Directory].

Sample of generated Java Source

If you check the checkbox of [Output the mapping files for Hibernate],
Not only Java Sources but also [.hbm.xml] files will be generated.

Unfortunately, you can not customize the template of Java Source used to generate.
See [Export test data] at [Create test data].
Here, it explains the method of making the custom template for Excel Document.
At first, download the standard template prepared with ERMaster.
Select [Window] -> [Preferences] in the menu of the Eclipse.

Select [ERMaster] -> [Template for Excel Document] in the left tree of [Preference] dialog.

push [Download template] button.

Then [Save as] dialog opens, so save the file in a suitable place.

Secondly, customize the downloaded standard template.
A standard template is composed of some seats.
The 1st sheet is a [Cover] sheet.

You may delete the [Cover] seat if unnecessary.
Moreover, the favorite number of seats of favorite name can be added,
if there are firmly attached seats.
These firmly attached seats are left for the generated Excel document as a firmly attached seat.
The 2nd sheet is a [history_template] sheet.

This sheet becomes to the list of change tracking.

It is generated by the [Change Tracking] data of current ER diagram.

The key words that can be used are defined in
[Keyword in history_template] of [words] sheet.
[Printing character] of [Sheet Name] becomes the genereted sheet name.

The 3rd sheet is a [sheet_index_template] sheet.

This sheet becomes to the list of the sheets of generated Excel,
and it has the links to the each sheet.

The key words that can be used are defined in
[Keyword in sheet_index_template] of [words] sheet.
[Printing character] of [Sheet Name] becomes the genereted sheet name.

The 4th sheet is [Diagram] sheet to stick ER diagram.

The sheet name of [Diagram] sheet is arbitrary. You may change to another name.
The image of ER diagram is put on the part described [$ER(width, height)].
In this case, the image is expanded and contracted to fit into width and the height specified in ()
with maintaining the fineness ratio of the size of the former image.
It can be described only [$ER] specifying neither width nor height.
In this case, the size of the image is used as it is as for the size.
Contents of each template sheet can be freely edited.
Moreover, an unnecessary template sheet can be deleted.
The template sheet is described by using the key word.
The key word that can be used is defined in the [words] sheet.
Neither each template sheet, the [words] sheet nor the [loops] sheet
remain in the generated Excel document.
The sheets will be generated by each table,
and the physical name or the logical name of the table becomes a sheet name.
The key words that can be used are defined in
[Keyword in table_template/category_template/all_tables_template] of [words] sheet.

There is a restriction that it is necessary to describe information on one column by one line.
The part described [$PIDX] or [$LIDX]

is replaced by the matrix table of the index.

Though it is not described in a standard template,
The number is sequentially applied from 1 to the part
where [$ORD] was described as information on the column.
Use it when the number is necessary.
The sheets will be generated by each index,
and the physical name of the index becomes a sheet name.
The key words that can be used are defined in
[Keyword in index_template/all_indices_template] of [words] sheet.

There is a restriction that it is necessary to describe information on one column by one line.
The number is sequentially applied from 1 to the part
where [$ORD] was described as information on the column.

The sheets will be generated by each sequence,
and the physical name of the sequence becomes a sheet name.
The key words that can be used are defined in
[Keyword in sequence_template/all_sequences_template] of [words] sheet.

The sheets will be generated by each view,
and the physical name or logical name of the view becomes a sheet name.
The key words that can be used are defined in
[Keyword in view_template/all_view_template] of [words] sheet.

The sheets will be generated by each trigger,
and the physical name of the trigger becomes a sheet name.
The key words that can be used are defined in
[Keyword in trigger_template/all_trigger_template] of [words] sheet.

It is a template to describe all columns of all tables.
The key words that can be used are defined in
[Keyword in column_template] of [words] sheet.

The name of this sheet can be specified by [Printing character] of [$SHTN] in
[Keyword in column_template] of [words] sheet.
The sheets will be generated by each category,
and the name of the category becomes a sheet name.
The key words that can be used are defined in
[Keyword in table_template/category_template/all_tables_template] of [words] sheet.
In the sheet of each category, all tables contained in the category are
described by the content.
To describe the header part of the category,
it is possible to specify row number which it is repeated from
as [First Line] of [category_template] of [loops] sheet.
Similarly, how many space lines is put between one table and the other table
is specified as [Space Line].

For instance, by the default template setting,
the value of [First Line] of [category_template] is [1],
so each category sheet has no header part,
and the area between the 1st row to last row of template will be repeated
for each tables with 5 space line between each other.
[category_template]

On the other hand, when looking at the setting of [all_indices_template] of the default template,
the value of [First Line] is [3],
so the area between the 1st row and 2nd row will be treeted as header part,
and the area between 3rd row to last row of template will be repeated
for each indices.
[all_indices_template]

Moreover, the sheet where tables not contained in any category were collected will be generated.
The name of this sheet can be specified by [Sheet Name] of [category_template] of [loops] sheet.
It is a template to describe all tables in one sheet.
The key words that can be used are defined in
[Keyword in table_template/category_template/all_tables_template] of [words] sheet.
All tables will be described as the content in this sheet.
To describe the header part,
it is possible to specify row number which it is repeated from
as [First Line] of [all_tables_template] of [loops] sheet.
Similarly, how many space lines is put between one table and the other table
is specified as [Space Line].
The name of this sheet can be specified by [Sheet Name] of [all_tables_template] of [loops] sheet.
It is a template to describe all indices in one sheet.
The key words that can be used are defined in
[Keyword in index_template/all_indices_template] of [words] sheet.
All indices will be described as the content in this sheet.
To describe the header part,
it is possible to specify row number which it is repeated from
as [First Line] of [all_indices_template] of [loops] sheet.
Similarly, how many space lines is put between one index and the other index
is specified as [Space Line].
The name of this sheet can be specified by [Sheet Name] of [all_indices_template] of [loops] sheet.
It is a template to describe all sequences in one sheet.
The key words that can be used are defined in
[Keyword in sequence_template/all_sequences_template] of [words] sheet.
All sequences will be described as the content in this sheet.
To describe the header part,
it is possible to specify row number which it is repeated from
as [First Line] of [all_sequences_template] of [loops] sheet.
Similarly, how many space lines is put between one sequence and the other sequence
is specified as [Space Line].
The name of this sheet can be specified by [Sheet Name] of [all_sequences_template] of [loops] sheet.
It is a template to describe all views in one sheet.
The key words that can be used are defined in
[Keyword in view_template/all_view_template] of [words] sheet.
All views will be described as the content in this sheet.
To describe the header part,
it is possible to specify row number which it is repeated from
as [First Line] of [all_view_template] of [loops] sheet.
Similarly, how many space lines is put between one view and the other view
is specified as [Space Line].
The name of this sheet can be specified by [Sheet Name] of [all_view_template] of [loops] sheet.
It is a template to describe all triggers in one sheet.
The key words that can be used are defined in
[Keyword in trigger_template/all_trigger_template] of [words] sheet.
All triggers will be described as the content in this sheet.
To describe the header part,
it is possible to specify row number which it is repeated from
as [First Line] of [all_trigger_template] of [loops] sheet.
Similarly, how many space lines is put between one trigger and the other trigger
is specified as [Space Line].
The name of this sheet can be specified by [Sheet Name] of [all_trigger_template] of [loops] sheet.
It is possible by [words] sheet not only to defining the key word
that can be used in each template sheet,
but also to changing the character which will be written in the generated Excel document
by editing the value of [Printing character] corresponding to each key word.
For instance, if you change [Printing character] of [PK] to [#] in [words] sheet,
in generated Excel document, if the column is a primary key, [#] is written at the position
where [$PK] is described in the template sheet.

In this sheet,
row number which it is repeated from is specified as [First Line] to describe the header part
of a sheet with repetition such as
To register the made template, push [New...] button in [Template for Excel Document] page
in [Preference] dialog.

The file selection dialog opens, so select the made template.

The selected template is added to the list of custom templates.

The registration of the template ends by this.
The registered template comes to be displayed in the template selection pull-down
of [Export as Excel Document] dialog.

It is possible to do a search for all data used in ER diagram.
It is possible to do a search for not only a logical name or a physical name
but also a type or a length, etc.
To do a search, push [Ctrl]+[F] key or select [Find] in the pop-up menu
which is displayed by right-clicking on the canvas.

[Search] dialog opens, so input the string used for the search,
and push [Find All] button.

Search results are displayed on [Result] tab of [Search] dialog.

To change the scope of the search,
after check off [All] check box, check the items in [Scope] of the search tab.

Moreover, the string for the search can be substituted.
Input [Replace Word] and select the item to be substituted from the search result list,
and push [Replace] button.

Though the substituted item disappears from the search result, the tables have been changed.

The data of ER diagram can be stored as a history.
It is possible to compare the current ER diagram with the history,
and to restore the data from the stored history.
[Change Tracking] dialog opens by selecting [right-clicks on the canvas] -> [Change Tracking].

Input [Contents of the change] in [Change Tracking] dialog, and push [Add] button.

Then the history will be added.

[Contents of change] of the history can be edited.
Select the history that you want to change in [Change Tracking] dialog,
and edit [Contents of change], and push [Update] button.

Then [Contents of change] will be changed.

The history can be deleted.
Select the history to be deleted in [Change Tracking] dialog,
and push [Delete] button.

Then the history will be deleted.

To compare current ER diagram with stored history,
select the history in [Change Tracking] dialog,
and push [Comparison display] button.

For the tables and the notes,


To restore from the saved history,
select the history, and push [Display the data of this data] button in [Change Tracking] dialog.

The dialog to confirm whether to save present data as a history is displayed.

It is changed to the selected history data, even if a present history is saved or isn't.

When you do [Import from Database], you can use [Translation] function.
[Translation] function enables the automatic conversion to logical name from physical name of objects.
[Translation] function use [Translation dictionary] to translate.
By default, [Translation] function is turning on only only when the locale of eclipse is japanese,
because there is only Japanese [Translation dictionary] that is provided by default.
So, first of all, it is necessary to prepare [Translation dictionary] file to use [Translation]
function excluding Japanese.
[Translation dictionary] file is described by the following Comma Separated Value format.
UTF-8 is used for encoding.
updated_date,AAA
date,BBB
first_name,CCC
last_name,DDD
name,EEE
item,FFF
It is not strict Comma Separated Value. The value to the first comma is assumed to be a physical name,
and the value after it assumes to be a logical name.
The words described in the dictionary are sequentially applied
to replace _*physical name*_ (regular expression) by the logical name.
Therefore, when [Translation Dictionary] is described as above, it is translated like
first_name -> CCC
item_name -> FFFEEE
item_ID -> FFFID
Moreover, because it is applied to both the capital letter and the small letter,
[ITEM_NAME] is translated into "FFFEEE" in the same way as [item_name].
The made dictionary file is registered by [menu] -> [Window] -> [Preferences...] -> [ERMaster] -> [Dictionary for translation].

When two or more [Translation Dictionary] files exist, they are applied sequentially according to the file list.
Therefore, properly change the order of files in consideration of the priority level.

[Translation Dictionary] file is not used only by being registerd.
To use [Translation Dictionary] file, it must be set in [Translation] dialog.
[Translation] dialog opens by right-clicking on the canvas and selecting [Management of translation].

To use [Translation Dictionary], check the checkbox of [Use translation].
(The checkbox is turning off by default excluding a japanese environment)
Next, check the checkbox of the dictionary file which you want to use to translate.

If the checkbox of [Use translation] is checked, [Translation] function is automatically used,
when [Import from Database] is executed,
When you do [Import from Database], if a necessary JDBC driver is not registered yet,
the dialog to set the JDBC driver opens.

If a correct setting is done once, this dialog is never displayed again.
If you want to change the path of JDBC driver which has been set once,
Select [ERMaster] -> [JDBC Driver] in [Preferences] dialog displayed
by selecting [Window] -> [Preferences...] in the menu of Eclipse.

ER Master does not contain JDBC driver.
So you must download from appropriate URL.
As a reference, I will write the download URL at the time of writing here.
| Database | JDBC Driver Jar | Download URL |
|---|---|---|
| DB2 | db2jcc4.jar, db2jcc_license_cu.jar | http://www-01.ibm.com/support/docview.wss?uid=swg21363866 |
| H2 | h2-<version>.jar | http://www.h2database.com/html/download.html |
| HSQLDB | hsqldb.jar | http://sourceforge.net/projects/hsqldb/files/hsqldb/ |
| MSAccess | sun.jdbc.odbc.JdbcOdbcDriver | - |
| MySQL | mysql-connector-java-<version>.jar | http://dev.mysql.com/downloads/connector/j/ |
| Oracle | ojdbc7.jar | http://www.oracle.com/technetwork/database/features/jdbc/index-091264.html |
| PostgreSQL | postgresql-<version>.jdbc4.jar | http://jdbc.postgresql.org/download.html |
| SQLServer | sqljdbc4.jar | http://www.microsoft.com/ja-jp/download/details.aspx?id=11774 |
| SQLite | sqlite-jdbc-<version>.jar | https://bitbucket.org/xerial/sqlite-jdbc/downloads |
It is possible to print by using a standard function of Eclipse.
select [File] -> [Print...] in the menu of Eclipse.
The print is done with the pages devided by fat lines in the grid lines.
Therefore, if there is a table on page division line as shown in the following figure,
the table extends over two or more paper when printing.

For this case, it is possible to adjust it by setting the expansion reduction
and setting the blank in [Page Setting] dialog.
In [Page Setting] dialog, it is possible to change the direction of print and the size of the paper besides this.
[Page Setting] dialog opens by selectiong [right-clicking on the canvas] -> [Page Setting].


When the expansion reduction rate etc. are changed in [Page Setting] dialog,
the position of page division lines are changed according to it.

Some setting for this ER diagram can be done in [Option] dialog
which is displayed by selecting [right-clicking on the canvas] -> [Option].


The database selected when the file is made can be changed in [Database] tab of [Option] dialog.

When the database is changed, the informations specific to the old database that can not be converted
to the informations for new database will be lost.

Things about [Tablespace] are in development.
In [Advanced Setting] tab, the informations specific to the current database can be set.
Available settings are different for each database.

If the checkbox of this option is checked,
When the fields of the logical name or the explanation or others get focus,
IME automatically changes into turning on.
By default, this checkbox is off.
Please check the checkbox if this function is necessary.

By default, the character that can be used for a physical name
is limited to [a-ZA-Z0-9_],
and if other characters are input, it becomes an input error.
If you want to use the other character for a physical name,
please check off the checkbox of this option.

Bezier curve can be used for a related line in ERMaster.
If you want to use Bezier curve, please check the checkbox of this option.
It is not possible to specify it for each line. This setting is applied to all lines.


By default, ER Master automatically validate the diagram file on saved.
If the file has some problem, warnings are displayed in [Problems] view,

and in [Package Explorer] view, warning mark is displayed on the file icon.

If you do not want to display these warnings, check the checkbox of [Suspend validator].

You can then create a test data along the ER diagram that you created,
and you can outputs it in several formats.
Select [Create test data] of the pop-up menu displayed by right-clicking on canvas.

Then click [Add] button in [Management of testdata] dialog.

Input the name of the test data, and select tables from [All tables] list and click [Add],
then they are moved to [Table in which data is made] list.

Next, chose one table from the selected tables and input the data.
When you finish to input the data, click [OK] button.

There are two methods of inputting data.
The first is a method of setting the value of data one by one.
This method is used when the accurate data is necessary.
The second is a method of setting information on the repetition.
This method is used when you want regular, a large amount of data.
Click [Direct Input] tab under the screen of the [Edit Testdata] dialog.
All rows except the final row become the data rows.
The value can be set to the cell by double-clicking the cell.

When you want to add the line, input data at the final line
or select [Insert] (or [Insert and Paste]) from the pop-up menu which is displayed by right-clicks.

Current timestamp can be set as a value of the cell by pushing [Ctrl] + [;].

In the input of the test data, the clipboard of OS can be used.
Because it can copy/cut/paste by assuming the data of the selected area
to be data of the tsv (tab separeted values),
It is possible to put it on ERMaster by copying it from Excel.
(Or, it is opposite of that. )
It is possible to copy/cut/paste by selecting from the pop-up menu
which is displayed by right-clicks,
or by pushing [Ctrl] + [c] / [Ctrl] + [x] / [Ctrl] + [v].
Click [Repeat Input] tab under the screen of the [Edit Testdata] dialog.

When the number of records to be made is input to the [Record Num] field,
the preview of the records which are made by the default repetition condition are displayed. (Previews are displayed up to 50. )

Preview value is editable, the color of edited cell become green.

To return to the original value after it is edited,
input the same value as original value.
The repetition condition is editable in the [Repetition condition setting] dialog
displayed by clicking the column header.


The type of the repetition condition that can be specified are 4 types. Such as
When this type is specified, null is set as for all values.


When this type is specified, the value is set according to the specified format.

Format
It is a format that becomes the origin of the value.
The part of the % of this format is replaced by the decided value
from other specification.
Repeat Num
After the same value is repeated of the frequency specified by this value,
the next value is used.
Start/End/By
The increasing value from the beginning value to the end value
is set to the part of the % of the format.

When the column type is a date type and if the format is specified like "yyyy-MM-%",
the next value of 2010-01-31 is 2010-02-01.


This type of the repetition is a default value for the column of the foreign key.
As for the column to which this type is set,
the values of the test data are set based on the values of the test data
of the column referred to as a foreign key.

Repeat Num
After the same value is repeated of the frequency specified by this value,
the next value is used.

Because only data with a different only figure can be made by the format type,
data "apple, orange, peach" cannot be made.
The enumeration type is used to make such data.

Enumeration values
The data to be set is enumerated by the changing line delimitation.
Repeat Num
After the same value is repeated of the frequency specified by this value,
the next value is used.

Though the clipboard of OS can be used in the method of repeating input data,
The function that can be used is only copy unlike in the method of repeating input data.

Select [Create test data] of the pop-up menu displayed by right-clicking on canvas.
Click [Edit] button in the displayed [Management of testdata] dialog.

When information of the test data is set as well as the addition of the test data,
click [OK] button.
Select [Create test data] of the pop-up menu displayed by right-clicking on canvas.
Select the test data to be deleted, and click [Delete] button
in the displayed [Management of testdata] dialog.

Select [Create test data] of the pop-up menu displayed by right-clicking on canvas.
Click [Export test data] button in the displayed [Management of testdata] dialog.

[Export test data] dialog is displayed, then
select [Test Data] and input [Format], [Output Directory] and click [Export] button.

Test data are output under the specified [Output Directory],
and their name become to the output file path.
So, if name of the test data contains [/], the sub directory will be made,
and test data file will be created under the sub directory.
ERMaster provides some Ant tasks.
Note that all these Ant tasks run only on Eclipse.
If you want to run these Ant tasks by batch file,
it is possible by using [equinox.launcher].
<?xml version="1.0" encoding="UTF-8"?>
<project default="ddl">

	<target name="ddl">
		<ermaster.ddl diagramFile="newfile.erm" outputFile="ddl.sql" encoding="UTF-8" />
	</target>

	<target name="image">
		<ermaster.image diagramfile="newfile.erm" outputfile="newfile.png" withCategory="true" />
	</target>

	<target name="report_html">
		<ermaster.reportHtml diagramFile="newfile.erm" outputDir="." />
	</target>

	<target name="report_excel">
		<ermaster.reportExcel diagramfile="newfile.erm" outputfile="newfile.xls"
			template="default_en" outputimage="true" uselogicalnameassheetname="true" />
	</target>

	<target name="testdata">
		<ermaster.testdata diagramFile="newfile.erm" outputDir="." format="0">
			<testdata name="init/xxx" />
			<testdata name="result/yyy" />
		</ermaster.testdata>
	</target>

</project>
If Ant is run on Eclipse in which the plug-in of ERMaster is installed,
Neither the setting nor any definition by Taskdef are necessary.
It is possible to run the task only by describing the task in build.xml.
When the following exception is thrown and it is not possible to run the task
though it is run on Eclipse,

It is because the JRE environment when Ant is run is not Eclipse.
Please set the JRE environment as follows.
1.Select [Run As] -> [External Tools Configurations...] from the menu which is displayed by right-clicking build.xml.

2.[Runtime JRE:] in [JRE] tab of [External Tools Configurations] dialog may be set to [Separate JRE], so set it to [Run in the same JRE as the workspace].

Ant tasks for ERMaster need Eclipse to execute.
But it is possible to run the task by batch file by using [equinox.launcher].
For instance, see below sample of batch file.
@echo off

set EQUINOX_LAUNCHER_JAR=c:/eclipse/4.3-2/plugins/org.eclipse.equinox.launcher_1.3.0.v20130327-1440.jar
set BUILD_FILE=./build.xml

if "%EQUINOX_LAUNCHER_JAR%" == "" goto HELP

pushd %~dp0
echo Launching equinox ...
java -jar %EQUINOX_LAUNCHER_JAR% -application org.eclipse.ant.core.antRunner -buildfile %BUILD_FILE% %1
goto end

:HELP
echo EQUINOX_LAUNCHER_JAR environment variable is not defined
goto end

:end
popd
pause
ERMaster provides the following four Ant tasks now.
The task for export a DDL.
<ermaster.ddl diagramFile="newfile.erm" outputFile="ddl.sql" encoding="UTF-8" />
The task for export a image.
<ermaster.image diagramFile="newfile.erm" outputFile="ddl.png" withCategory="true" />
The task for export Html document.
<ermaster.reportHtml diagramFile="newfile.erm" outputDir="html_report" />
The task for export the Excel document.
<ermaster.reportExcel diagramFile="newfile.erm" outputFile="sample.xls"
	template="default_en" outputImage="true" useLogicalNameAsSheetName="true" />
The task for export test data which are defined on ERMaster.
<ermaster.testdata diagramFile="newfile.erm" outputDir="." format="0">
	<testdata name="init/xxx" />
	<testdata name="result/yyy" />
</ermaster.testdata>
ERMaster provides the extention point.
Here, I will introduce how to extend the ERMaster.
It is able to add a your own menu to the popup menu.
Here, I will introduce how to extend popup menu,
by add simple [Greeting] menu to popup menu.
If select [Greeting] from popup menu, the message dialog will be open with the message "Hello World!".


Firstly, create the Eclipse plugin project.
From menu of Eclipse, select [File] -> [New] -> [Project]

In [New Project] dialog, select [Plug-in Project] and push [Next] button.

Input [Project name] field and push [Next] button.

Input [Name] field, and if necessary edit [Activator] field,
and then push [Next] button.

Then plugin project will be created, and [plugin.xml] file will be opend.

Then open [Dependencies] tab, and push [Add] button of [Required Plug-ins].

Then select [org.insightech.er] (ERMaster) plugin, and push [OK] button.

Also add [org.eclipse.gef] plugin as well.

Then open [Extensions] tab, and push [Add] button of [All Extensions].

In [New Extension] dialog, input [insightech] to [Extension Point filter] field,
and select [org.insightech.er.popupMenus], and push [Finish] button.

As a result, [org.insightech.er.popupMenus] extension will be added.

Then input "Export" to [path] field, and input arbitrary class name to [class] field.
At this point, the specified class does not need to be created.
Because by next step you will create the class to click [class] link.
The value "Export" which is input to [path] field will be used to decide the location of your extention menu in [Popup] menu of ERMaster.
Available value are only "Export" or "Import".
See also [org.insightech.er.editor.view.ERDiagramPopupMenuManager.java] of ERMaster source.

When [class] link is clicked, [New Java Class] dialog open.
Edit [package] field and [Name] field, and push [Finish] button.

Then the specified class will be created.

Here, aside this class for now, and create [Action] class which implements your extention menu.
It is recomended to extend [org.insightech.er.editor.view.action.AbstractBaseAction.class] which
provides some useful method.
In the sample in the figure below, it spedifies "Greeting" as the label of menu,
and if the menu will be clicked, the message dialog will be open with the message "Hello World!".

After you create the [Action] class, edit the [createIAction] method of the [Action Factory] class
to create the instance of the [Action] class.

Creating a sample extention menu is complete.
So now, run for test.
To test the eclipse plugin, right click the project, and select [Run As] -> [Eclipse Application] from popup menu.

Then another Eclipse is launched.
So create [.erm] file, and check [Greeting] menu from being added to the popup menu.
If select [Greeting] from popup menu, the message dialog will be open with the message "Hello World!".
To create jar file of plug-in that was created, right click the project, and select [Export] from popup menu.

In [Export] dialog, select [Plug-in Development] -> [Deployable plug-ins and fragments], and push [Next] button.

Finally, input arbitrary path to [Directory] field, and push [Finish] button.
Then plug-in file will be created.

Now I introduced the way of creating simple menu.
To create more practicable menu, please refer to [source code of ERMaster].